
Why this case matters
A motor does not operate at one torque and one speed. Its useful design is decided across everything it has to do.
Many optimization studies improve a machine at a single operating point. That makes the calculation manageable, but it can miss what happens during real operation: a geometry that excels in one condition may move losses somewhere else in the duty cycle.
Alexander Schugardt’s doctoral research at TU Berlin approached the rotor as a multi-objective, multi-physics design problem. The goal was to reduce permanent-magnet material while maximizing efficiency over a complete vehicle drive cycle, rather than only at a rated point.
Starting point
Reference rotor
The manufactured baseline machine: eight buried magnets, each with short air pockets at its ends. Every optimized candidate had to beat this rotor on its own drive cycle.
The baseline
Topology-optimized
Optimized rotor
The optimizer places material freely, and air pockets appear in shapes no catalog drawing contains. This variant was carried through to manufacturing and measurement.
Free material layout
Both cross sections are drawn to one scale from the study’s simulation models, not artist impressions.
The design task
Improve two objectives without breaking five conditions.
Removing magnet material is not a result if the motor can no longer produce the required torque, fit its electrical limits, or survive at speed. Every candidate had to earn its place inside the complete set of requirements.
Objective 01
Maximize drive-cycle efficiency
Objective 02
Minimize magnet material
Hard constraints
- Reach every required operating point on the drive cycle
- Stay inside the available voltage and current limits
- Maintain mechanical strength at 120% of maximum speed
- Withstand the defined transient demagnetization case
- Produce geometry that can be manufactured and assembled
The drive cycle
Preserve real operation without simulating every point in every iteration.
A complete drive cycle contains too many operating points to evaluate directly inside every generation of a stochastic optimization. The study therefore grouped the duty cycle and selected five representative operating points with individual weightings.
For the investigated cycle, calculating the overall efficiency from those representative points differed by only 0.2% from calculating all operating points. That made the optimization computationally manageable while keeping the real duty cycle in the objective.
5
representative operating points
0.2%
difference in calculated overall efficiency
The duty cycle
600 seconds of demanded vehicle speed, the WMTC cycle the study optimized for. Every second asks the motor for one combination of speed and torque.
The same cycle, seen by the motor
Those demands land as operating points in the torque-speed plane. They group into five clusters, and one weighted point per cluster stands in for the whole cycle inside the optimization.
The optimization loop
Every new geometry had to pass through both physics and production logic.
The automated process did more than vary a drawing. It built a valid model, applied geometric filters, ran electromagnetic and mechanical evaluations, checked constraints, and returned the result to the optimizer.
01
Propose a geometry
The optimizer changes the material distribution, the air pockets and, where allowed, the embedded magnet geometry.
02
Prepare and check it
Filters and smoothing remove unusable details before the geometry is checked for a valid simulation model.
03
Evaluate the physics
Electromagnetic simulations evaluate torque, voltage, and losses. A mechanical FEM checks stresses and displacement.
04
Score and repeat
Objectives and hard constraints are combined into the evaluation that guides the next set of candidates.
The selected result
Less magnet material, with the required operation preserved.
These figures describe this specific reference machine, drive cycle, design space, and set of constraints. They are evidence of the process, not a percentage guarantee for another motor.
10%
less magnet material
The final selected geometry used ten percent less magnet volume than the reference rotor.
2.4%
lower rotor mass
The changed magnet and air-pocket geometry also reduced the total rotor mass.
Same
simulated drive-cycle efficiency
Across the considered drive cycle, the optimized design maintained the simulated efficiency of the reference machine.
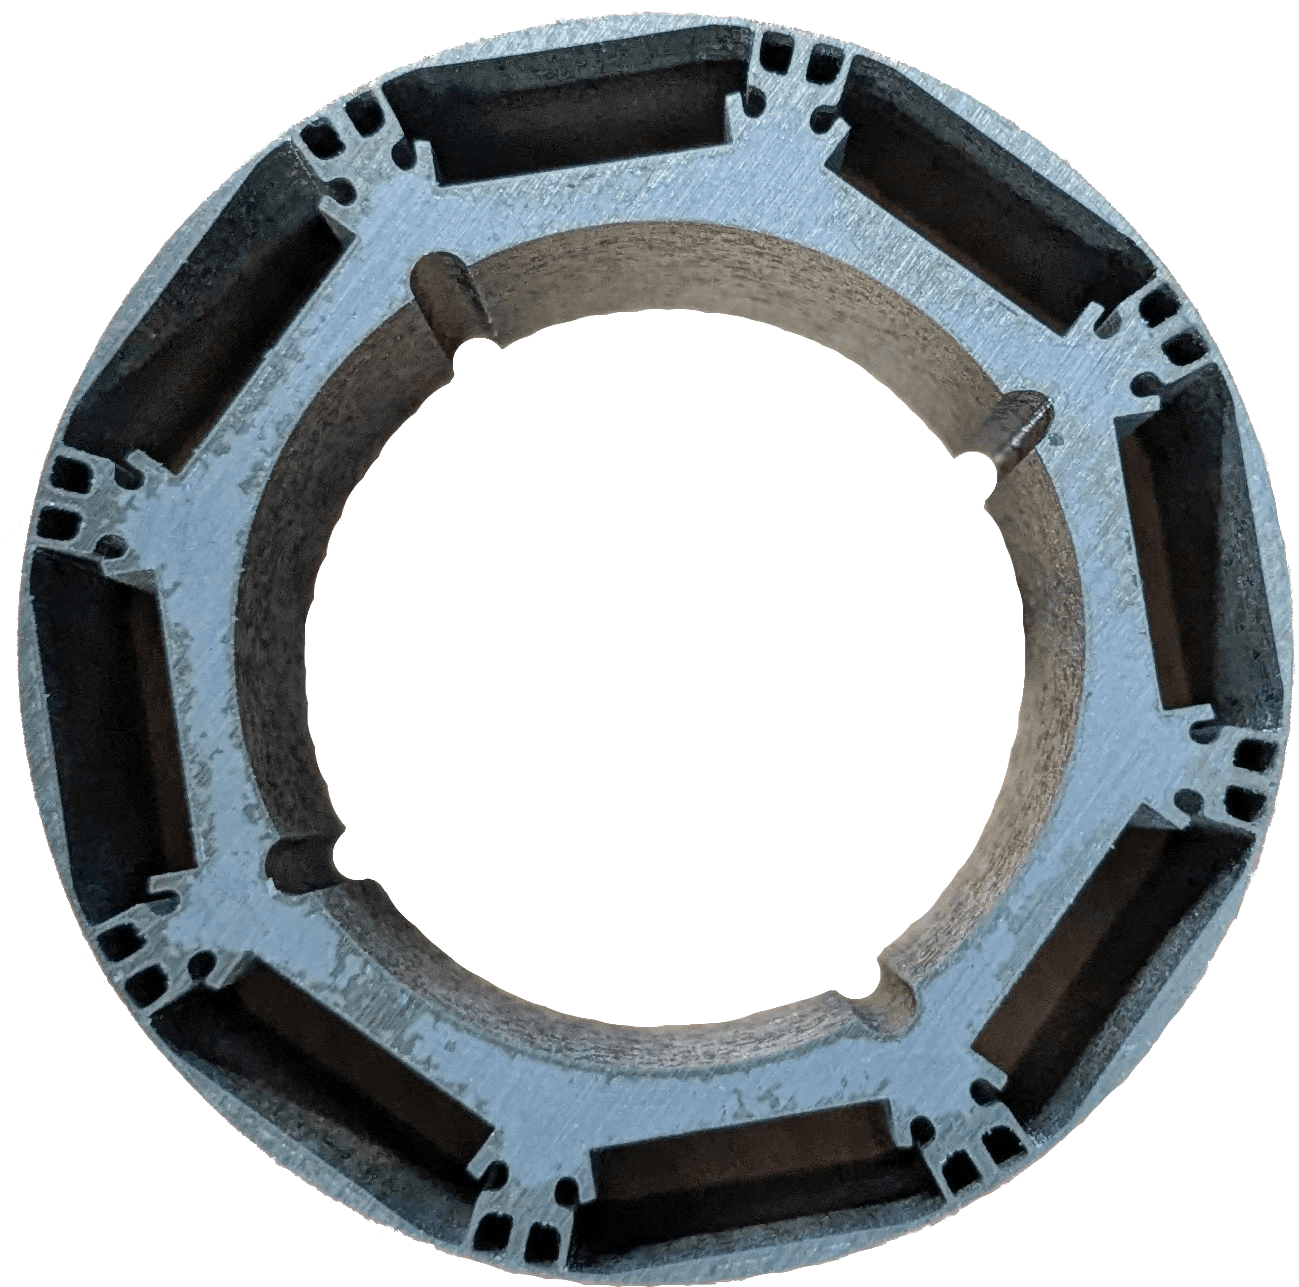
From design to metal
Two rotor variants were manufactured and assembled.
Before manufacturing, small radii and air-pocket details were adjusted where necessary. The modified geometry was simulated again, followed by a higher-resolution mechanical strength assessment.
The rotor laminations were laser cut, bonded into stacks, equipped with the permanent magnets, and assembled into the reference machine. That step matters: a mathematically attractive contour only becomes an engineering result when it can survive the path into hardware.
Measurement
The simulations were checked against the physical rotors.
Back-EMF, torque, and efficiency maps were measured for the manufactured rotors. The back-EMF results fell inside the measurement tolerance, and the torque deviations were within the range of measurement uncertainty.
Differences of up to 2% appeared between simulated and measured efficiency. The study attributes these differences to effects that were not fully represented in the simulation, including inverter supply, manufacturing effects, circulating currents, and end effects. With the measuring-device uncertainties included, the simulations were validated for the scope of the work.
That distinction is important. Validation does not mean that simulation and hardware become identical. It means the remaining difference is measured, explained, and judged in the context of the engineering decision.
Simulation
Measurement
Efficiency maps of the topology-optimized rotor, redrawn from the study’s data. The empty region at high speed and torque lies outside the machine’s voltage and current limits.
What the case shows
Less material, full performance, proven in hardware.
Optimized for real operation
The rotor was improved across its complete drive cycle, not at one flattering operating point. Five weighted points carried all 600 seconds of demanded operation into every design evaluation, at 0.2% accuracy.
Nothing sacrificed
Ten percent less magnet material and 2.4% less rotor mass, at the reference machine’s drive-cycle efficiency, with mechanical strength, demagnetization and manufacturability enforced on every candidate the search produced.
Proven in hardware
Two optimized rotors were manufactured, assembled and put on the test bench. Back-EMF and torque matched the simulations within measurement tolerance, validating the complete chain from drive cycle to metal.

About the research
Dr. Alexander Schugardt
Alexander is CTO and co-founder of Neuraway AI. His doctoral work focused on multi-criteria shape and topology optimization of permanent-magnet synchronous machines across drive cycles.
Meet the founders